TUI — phases vs runtime activity
The TUI shows two different kinds of “what is going on” information. They complement each other; they are not the same signal. A single live run frame carries both at once — the figure in Runtime Activity row shows the phase transcript, the Activity strip, the sidebar, and the status bar side by side so you can see which region answers which question.
Maturity: Daily-use observability surface. Use these signals while work is running; use Agent Debugger when you need durable replay after the run.
What problem this solves
Section titled “What problem this solves”Long runs can involve tools, child agents, queues, permissions, PTY output, and background jobs at the same time. Runtime signals separate live activity from persisted phase history so the TUI can show what is active without pretending to be a full process recorder.
Phase timeline (gloss / ledger)
Section titled “Phase timeline (gloss / ledger)”Phase labels (including /gloss and the get_session_phases tool) come
from the persisted run ledger for the session. They answer: which phase
labels were recorded for this run (for example plan → tools → execute), not
which OS process or remote command is live right now.
Agents can read the same timeline with the get_session_phases tool; see
Tools. In the figure under
Runtime Activity row, this is the transcript pane
(THINKING → TOOL → AGENT → OBSERVE), distinct from the live Activity strip
beneath it.
Runtime Activity row
Section titled “Runtime Activity row”The Activity strip is on by default (config nil-guard). The strip
above the chat summarizes coarse in-flight work: tools, child agents,
permissions, the prompt queue, PTY output (class-level), scheduler jobs, and
high-level bash runtime classes (for example remote sandbox ssh /
docker vs local shell vs background job), plus PTY lifecycle (spawn /
exit / kill) as first-class signals without exposing command lines. It is meant
as a live coordination surface, not a process list and not a transcript.
Set options.tui.runtime_activity_row = false in bmo.toml to hide the strip.
The frame below is one active Coordinator run, captured exactly as the TUI draws it. Read it from the highlighted band outward:
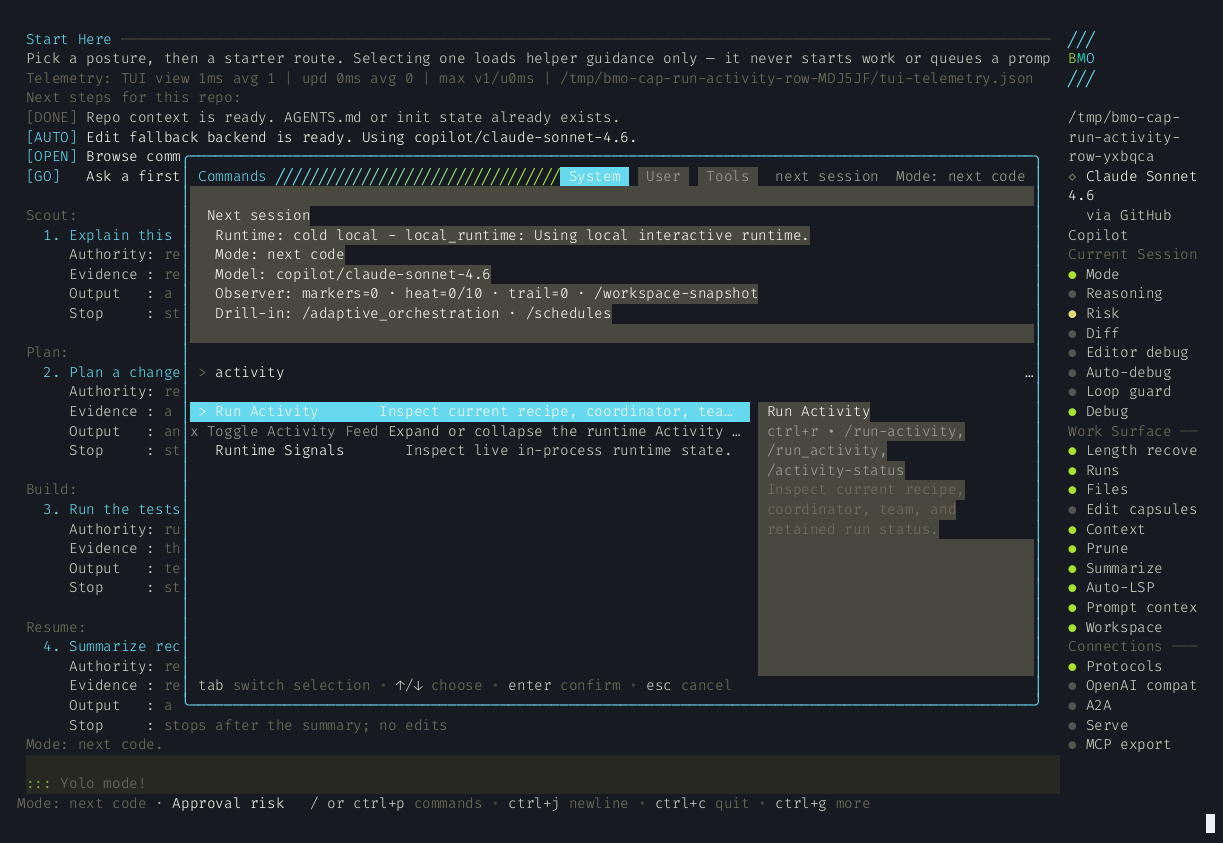
- The highlighted Activity strip (
tools 2 · agents 1 · pty ssh · scheduler quiet) is the coordination surface this section is about: counts and runtime classes, never command lines. - The phase transcript pane above it (
THINKING → TOOL → AGENT → OBSERVE) is the other kind of signal — the persisted story of the run, not live process state. - The sidebar and the status bar carry the per-feature and heartbeat signals described in the next two subsections; they stay readable while work runs, which is the whole point of keeping the strip out of the transcript.
Quality Gates use this surface sparingly: judging-in-progress, armed send-back, and escalation can appear as compact activity text. Normal pass and advisory warning decisions stay out of the chat surface; inspect them in Agent Debugger instead.
Codebase context snapshots publish Activity annotations during prompt
preparation when options.codebase_context is enabled (default on): Codebase
context snapshot built, reused, is stale, or failed. These are metadata
integrity signals, not file listings. See
Codebase context snapshots.
Use /runtime-signals as the named live summary for this family. From
there, /activity toggles the feed row and ctrl+a expands or collapses
the recent-activity strip in place.
When the sidebar Run block reflects a live coordinator, team, or recipe run, clicking any active run row opens the Run Activity dialog so you can inspect the current status summary without leaving the chat surface. After the run is retained, the sidebar switches to result-oriented actions such as Run result review or opening the saved artifact. The sidebar column in the frame above (provider, context, MCP, LSP) is where these per-feature signals live.
Provider-boundary TPM recovery hops are one of those live rows: during an
active run, the sidebar can show the current Provider hop (or Local last
resort) with the bounded from -> to provider/model identity. The row clears
when the run ends or a new run starts.
Status bar
Section titled “Status bar”The bottom status bar stays a heartbeat: session mode, tiered primary /
secondary hints, optional run-progress text (when
options.tui.run_progress_in_tui is on), and key hints. Prefer the Activity
row when you need multiple concurrent stories at once. In the frame above it
is the bottom line reading Mode: code · Coordinator active · … — one steady
line, not a feed.
For active coordinator-owned runs, the primary status token uses
Coordinator active. Other run owners use the same pattern
(Team active, Recipe active) so the label tells you which surface is
currently driving the work.
Boundary against run observability
Section titled “Boundary against run observability”Runtime signals stay live and TUI-owned. They answer what is active right now in this terminal session. They do not replace the durable run-family surfaces:
/glossis the persisted phase timeline./run-observabilityis the durable session-family summary, cue, and trace-lens family.- Agent Debugger is the recorded run-history drill-in after a run ends.
Configuration
Section titled “Configuration”options.tui.runtime_activity_row— toggles the Activity strip (default true; set false to disable; see Configuration). Older configs may use[ui] runtime_activity_row; it only applies when the canonicaloptions.tui.*key was not set, and never overrides an explicit canonical false.options.tui.query_focus_events— whether the TUI probes the terminal for focus-in/out support during startup (default true; set false to skip).options.tui.run_progress_in_tui— gate some run-progress copy on the status bar; phase timeline forwarding for gloss is independent of this flag (see ui-event-wiring.md).
See also
Section titled “See also”- Operator questions —
/questions, permission/MCP/clarification modals, and the unified queue - Configuration —
options.tui.runtime_activity_row,run_progress_in_tui, and config-only surfaces such asoptions.compaction.reaction_gate(with/compactionwhen reactions usecompaction_idle_gate). - Quality Gates — optional post-draft judging and send-back status.
- Staged Workflow — plan vs execute gating
- Session Modes
- Tools —
get_session_phases,bash,job_output - Workflow map - how runtime signals fit into the broader request-to-action flow.