
Run Observability
Run observability is the fast operator read over recent run state. It answers
bounded questions — counts, cue phase, latest run_id, routing — without
loading the full Agent Debugger event stream.
Think of it as three lenses on the same app-owned ledger builders in
internal/app:
- Session summary — “what does this session’s recent window look like?”
- Cue ledger — “who acts next, with what expected evidence?”
- Trace lens — “which tools ran in this one run?”
The summary and cue ledger now also carry a bounded progress-owner digest for
the latest run. It distinguishes provider recovery/wait, active tool work, and
terminal residue without forcing an immediate jump into /debugger.
This page teaches the path in order, with live TUI captures from a real provider turn.
When to use which surface
Section titled “When to use which surface”| Question | Start here | Then if needed |
|---|---|---|
| Recent run counts / latest id | Step 1 below | — |
| Next actor / expected evidence | Step 2 | /debugger for full history |
| Ordered tool calls in one run | inspect_run_trace | /debugger for non-tool events |
| Step-by-step audit | Agent Debugger | — |
| Wedge, stall, or opaque runtime behavior | Runtime incident capture | — |
| Cross-run narrative or operator annotation trail | Journal | — |
| Durable interruption or handoff state | Session continuity capsules | — |
| Ledger store health | Run ledger /run-ledger | — |
Step 1 — Session summary
Section titled “Step 1 — Session summary”Run one real turn, then:
/run-observabilityAlias: /run_observability.
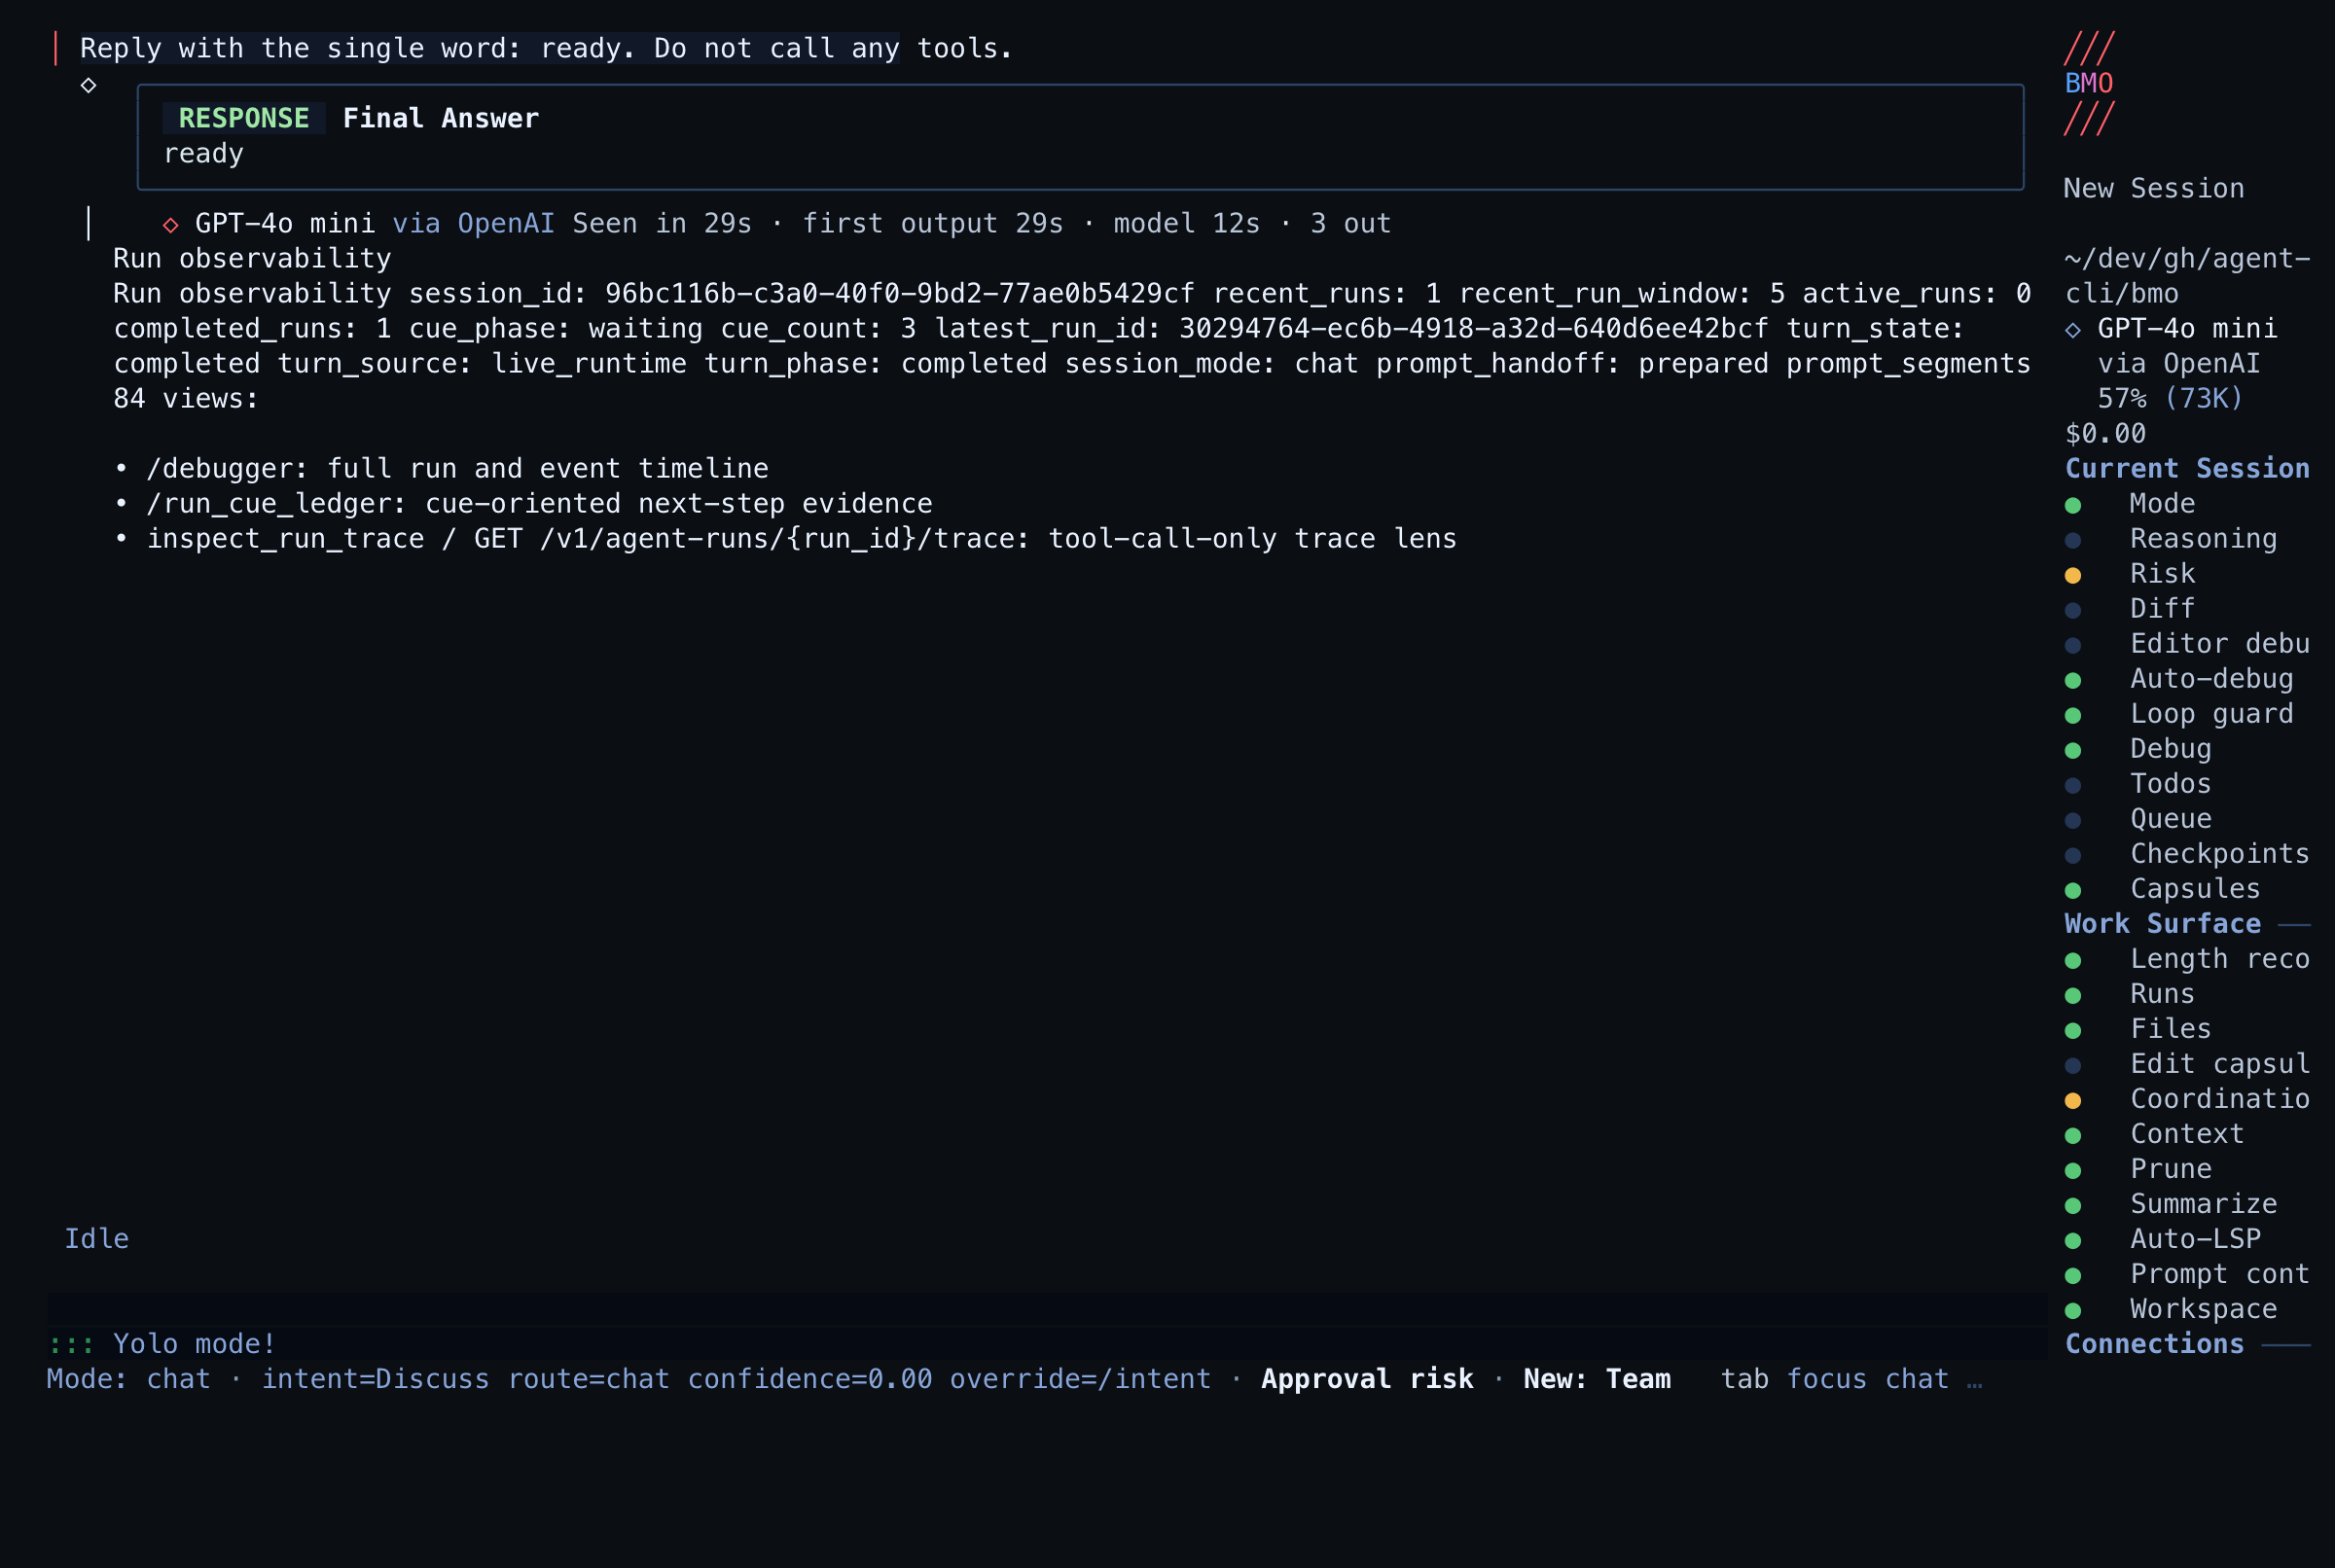
Read the frame:
| Field | Teaches |
|---|---|
session_id | Correlation for HTTP/tools (local operator use) |
recent_runs / recent_run_window | How many rows feed the summary |
active_runs / completed_runs | Whether work is in flight |
cue_phase / cue_count | Where cue serialization is in the turn |
latest_run_id | Anchor for trace reads |
turn_state / prompt_segments | Live turn intent merge |
views: block | Routing — where to go next |
The summary is read-only. It does not mutate runs or grant authority.
Headless discoverability
Section titled “Headless discoverability”bmo config show-run-observability lists the family and truth contract without
claiming live session access — the CLI runs out-of-process.
Step 2 — Cue ledger
Section titled “Step 2 — Cue ledger”When the question is who acts next, open the modal ledger:
/cue-ledgerAliases: /cue_ledger, /run-cue-ledger, /run_cue_ledger.
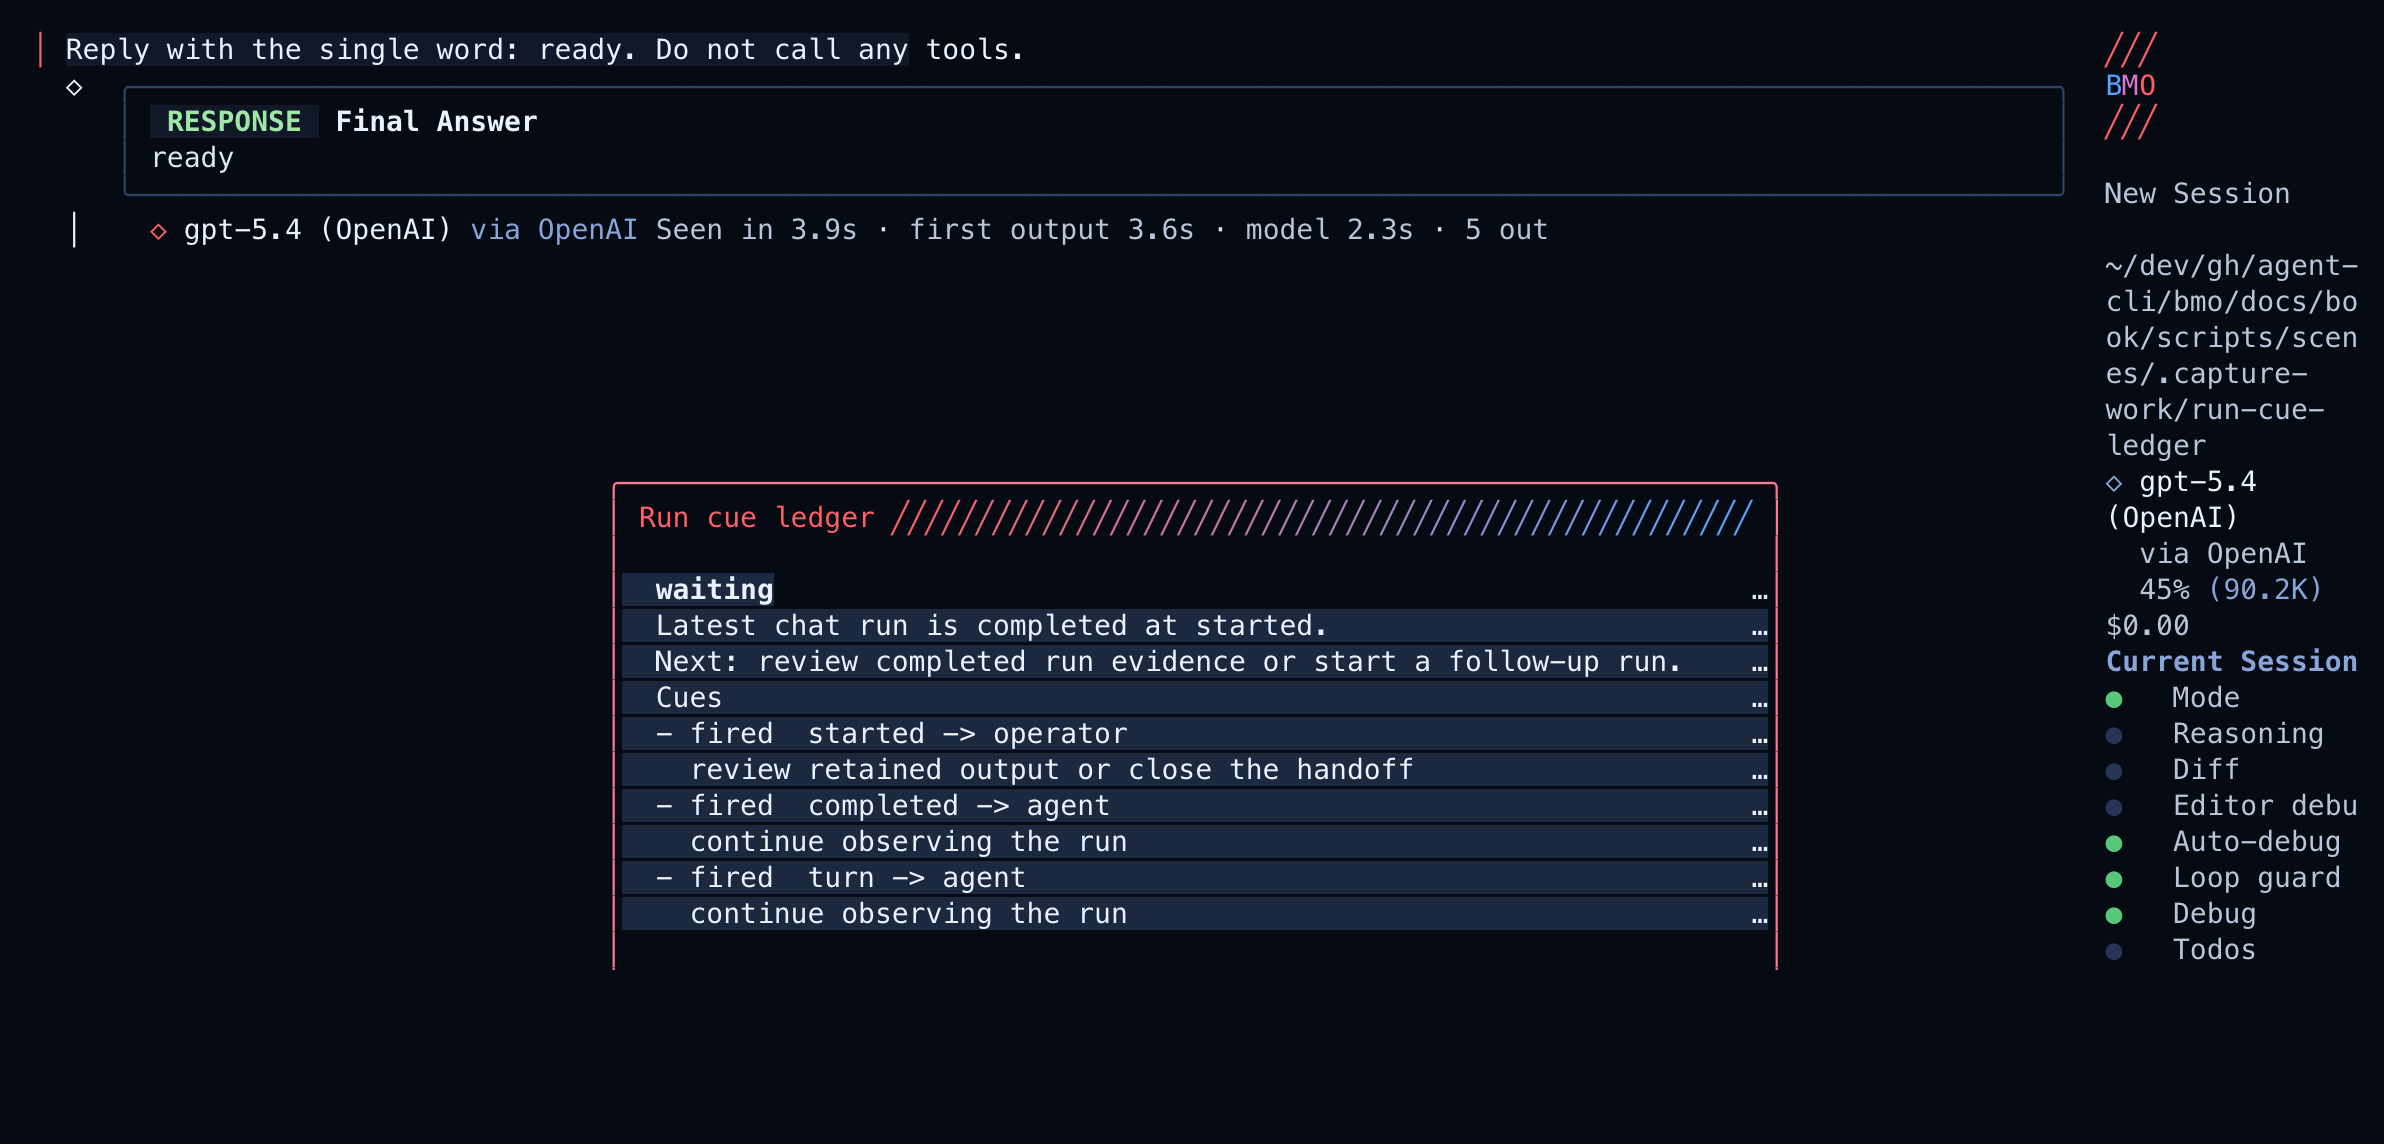
Cue rows project the same session-family run list into:
- active actors
- cue state and phase
- expected next action
- expected evidence and recovery controls
Use this before spawning follow-on work — it is the “cue book” complement to the debugger’s “film reel.”
Non-interactive enforcement receipts
Section titled “Non-interactive enforcement receipts”The same non-interactive bmo run --quiet envelope also carries
run_summary.enforcement when you need a bounded answer to “what did the
guardrails do during this invocation?” without replaying the full trace.
For the tool-execution gate, read:
enforcement_projection_status—measuredmeans BMO captured an invocation-start baseline and the counters below are a real invocation delta;unavailablemeans no baseline existed, so the projection refuses to attribute process-lifetime totals to this one run.tool_gate.invocation_by_outcome— bounded mix ofallow,deny,require_approval, andunevaluated.tool_gate.invocation_by_deny_class— bounded denial partition that keeps “approval friction” separate from profile or session-mode denials.tool_gate.invocation_denied_unclassifiedandtool_gate.invocation_denied_unmapped_evaluator— drift signals. Both are expected to stay at zero; a nonzero value means the deny vocabulary or evaluator mapping moved ahead of the projection.
The sibling run_summary.enforcement.verdict receipt is documented on
Verdict grades.
Step 3 — Trace lens (one run)
Section titled “Step 3 — Trace lens (one run)”For a bounded per-run trace without the broader event stream:
- TUI / agent:
inspect_run_tracewithrun_id(defaults to latest when bound) - HTTP:
GET /v1/agent-runs/{run_id}/trace
The trace lens includes a tool-event list containing only kind=tool rows.
It also projects lifecycle outcome, activity-ledger, and corridor_shadow
evidence when those durable rows exist. Raw phases, lifecycle event rows, and
assistant text stay in /debugger / get_agent_run_events.
Operator surface map
Section titled “Operator surface map”| Surface | Scope | Purpose |
|---|---|---|
bmo config show-run-observability | config only | Discoverability; no live store |
/run-observability | session family | Summary hub + view routing |
/cue-ledger | session family | Next-step cue projection |
GET /v1/sessions/{id}/observability | session family | HTTP summary |
GET /v1/sessions/{id}/run-cue-ledger | session family | HTTP cue twin |
GET /v1/agent-runs/{run_id}/trace | one run | HTTP trace lens |
session_observability | session family | Native agent summary |
run_cue_ledger | session family | Native agent cue tool |
inspect_run_trace | one run | Native agent trace lens |
| MCP twins | same | bmo_get_session_observability, etc. |
Truth boundary
Section titled “Truth boundary”Live surfaces read shared app builders (SessionObservabilityPayload,
RunCueLedgerPayload, RunTracePayload). HTTP, TUI, native tools, and MCP stay
aligned without HTTP-as-internal-dependency.
Teach the full audit path
Section titled “Teach the full audit path”A typical investigation after a bad turn:
/run-observability— confirmrecent_runsand copylatest_run_id/cue-ledger— see whether a cue is blocked or waiting on evidence/debugger— open the run list, then the timeline (see Agent Debugger)/run-ledger— if stores look wrong, read posture and ring tail ( Run ledger)
If the problem is no longer “what did this run do?” but instead “why did the runtime wedge?”, move to Runtime incident capture. If the question becomes “what is the dated story across runs or handoffs?”, leave this surface for Journal or Session continuity capsules.
flowchart LR
  turn[Completed turn] --> summary["/run-observability"]
  summary --> cue["/cue-ledger"]
  summary --> dbg["/debugger timeline"]
  dbg --> fork[fork checkpoint]
  summary --> trace[inspect_run_trace]
  posture["/run-ledger"] -.-> summary
Related
Section titled “Related”- Run ledger — durable vs compat stores and sticky-degraded
- Agent Debugger — full
agent_run_eventsreplay - Fleet runtime observability — fleet regulation sibling
- Session observability parity
- Tools Reference
- Slash Commands