Sidebar Diagnostic Surfaces
When something needs your attention — a provider is rate-limited, a connection needs re-authorizing, a run just failed — BMO’s sidebar takes you straight to the screen that fixes it. Instead of opening a generic panel and leaving you to hunt for the problem, a sidebar click opens the specific diagnostic dialog that matches what’s actually wrong right now.
Maturity: Daily-use surface. This is the fastest way to act on a problem the sidebar is already flagging — no menu diving required.
Why this matters
Section titled “Why this matters”A generic panel makes you do the routing work yourself: notice the warning, remember which screen owns it, navigate there. BMO’s sidebar does that routing for you. Because it inspects live system state at the moment you click, the same sidebar row can take you to different places depending on what needs attention — so the click is always relevant to the situation in front of you.
What opens when you click
Section titled “What opens when you click”When you click a sidebar row, BMO reads the current system state and picks the single most urgent problem to act on. If several things are wrong at once, it follows this priority order so the most pressing issue wins:
| If this is happening… | Clicking the sidebar opens… |
|---|---|
| A provider is in an error or cooldown state | Provider diagnostics |
| A connection (MCP) needs re-authorization | MCP connection dialog |
| Your last finished run ended in failure | Run result review |
| A workspace conflict was detected | Workspace strategy dialog |
| BMO is actively pruning context to stay in budget | Context lineage inspector |
Read top to bottom: a provider error always wins over a context-pruning notice,
because it’s more likely to be blocking your work. (Internally, each row is the
priority order — 1 through 5 — of the matching DiagnosticIntent.)
Which rows behave this way
Section titled “Which rows behave this way”These four sidebar indicators redirect to a focused diagnostic surface whenever there’s a matching problem to solve:
- Provider health → provider diagnostics, when a provider is in an error state
- Protocols / MCP → the MCP connection dialog, when a connection needs auth
- Context / Lineage → the context lineage inspector, while pruning is active
- Run result → run result review, when your last retained run failed
Live runs are different. While a run is in progress, clicking its row opens the Run Activity dialog so you can watch it — the smart routing only kicks in after a run ends in failure and BMO is surfacing that result.
How you’ll know there’s something to click
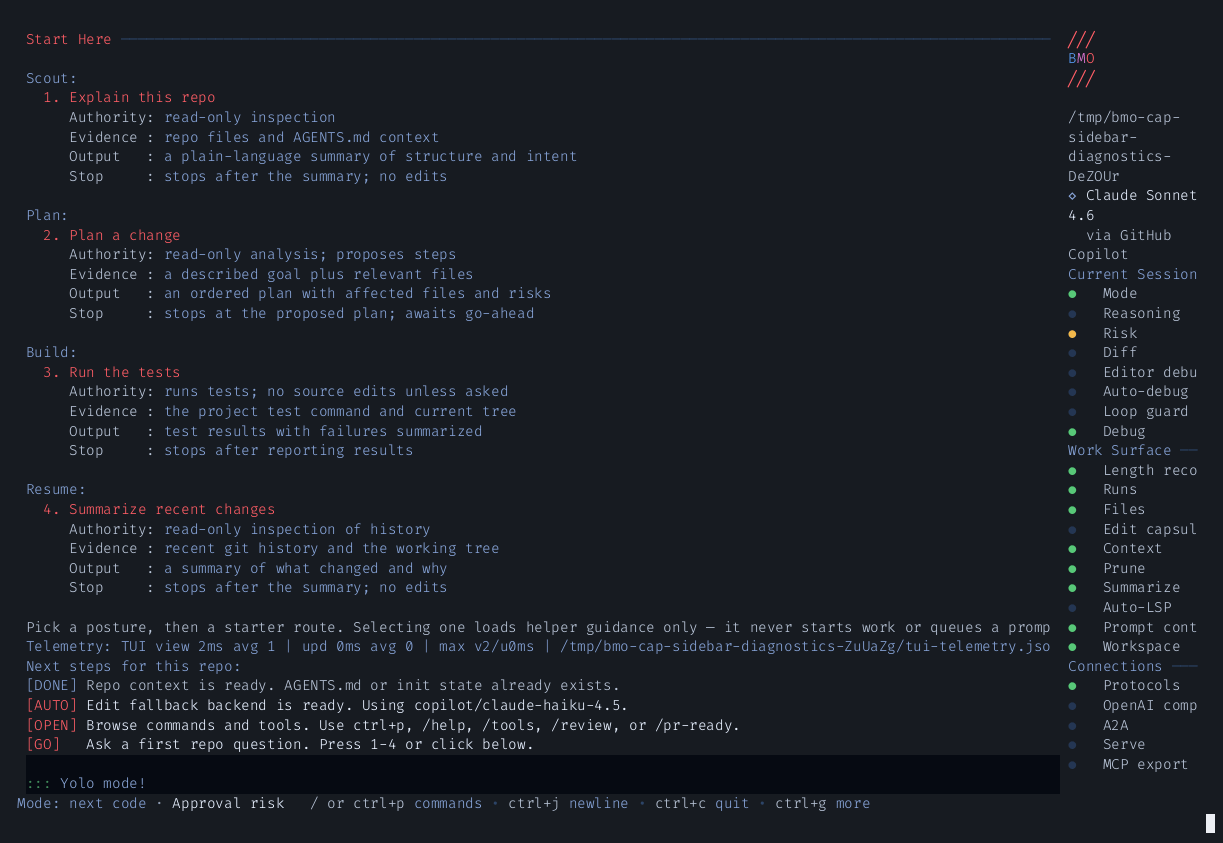
Section titled “How you’ll know there’s something to click”When a row has an actionable problem behind it, its label shows a leading !
— for example ! openai — cooldown. That mark is your cue that clicking will
open a diagnostic surface rather than the usual panel.
When nothing is wrong
Section titled “When nothing is wrong”If there’s no active problem, the row behaves normally: clicking it opens its default view (for example, the generic context hub). The smart routing is purely additive — it only changes a click’s destination when there’s a real issue to take you to.
Related sidebar rows that always report
Section titled “Related sidebar rows that always report”A few sidebar rows aren’t part of the smart routing — they always open a read-only status report, no matter the system state:
- Ripple —
/rippleorbmo config show-ripple(Ripple Edits) - OAI-compat —
/openai-compatorbmo config show-openai-compat - Files —
/filesorbmo config show-file-tools(File Tools Telemetry) - Runtime incidents —
/incidentsfor bounded posture;/incidentremains capture and/incident-issueremains dry-run issue drafting
When the sidebar does not already tell you which surface to open, use Run Observability as the bounded first read, then escalate to Agent Debugger, runtime incidents, Journal, or continuity surfaces based on the question you are actually trying to answer.
How routing is decided
Section titled “How routing is decided”Each sidebar row maps to a diagnostic intent. When you click a row, BMO reads current provider health, MCP connection state, run UX, and prompt-trace signals, picks the single highest-priority active intent, and opens the matching read-only status surface. When no intent is active, the row falls back to the default sidebar panel.
Visual: intent-derived sidebar routing
Section titled “Visual: intent-derived sidebar routing”A sidebar row click reads current provider, MCP, run, workspace, and context state, derives the active diagnostic intent, and routes to the matching read-only status surface:
flowchart LR
    click["Sidebar row click"] --> state["Read current provider, MCP, run, workspace, and context state"]
    state --> derive["Derive active DiagnosticIntent"]
    derive --> priority{"Highest active intent"}
    priority -->|"provider_error"| provider["Provider diagnostics"]
    priority -->|"mcp_auth_required"| mcp["MCP connection dialog"]
    priority -->|"run_failed"| run["Run result review"]
    priority -->|"workspace_contention"| workspace["Workspace strategy dialog"]
    priority -->|"context_pruning_active"| context["Context lineage inspector"]
    derive --> none["No active intent"]
    none --> fallback["Default sidebar panel"]
Behavior visual
Section titled “Behavior visual”The live sidebar frame below shows the provider, MCP, context, and run signals that feed the routing decision: