
Agent Debugger
Agent Debugger is BMO’s durable timeline surface for agent_runs and
agent_run_events. Use it when chat text is not enough to explain a failure:
you need the ordered evidence — prompt assembly, tool calls, checkpoints, and
terminal status — and sometimes branch-and-continue from a checkpoint-backed
step (session transcript + session-scoped files; not deterministic replay).
Maturity: Maintainer-facing observability. Normal coding rarely starts here; reach for it after a run misbehaves, stalls, or surprises you.
This page walks the operator path in order, using live TUI captures from a real provider turn (not echo fixtures).
Before you open the debugger
Section titled “Before you open the debugger”Runs must exist in the durable ledger. In practice that means:
- Complete at least one turn in the current session (any real model provider).
- Confirm the bounded summary if you want counts and routing first — see Run observability.
- Open
/debuggerwhen you need the full timeline.
The debugger lists the session family: rows where session_id or
parent_session_id matches the parent session, so child spawn runs appear
beside the parent conversation.
Step 1 — Scan the bounded summary (optional)
Section titled “Step 1 — Scan the bounded summary (optional)”/run-observability is the fast read: recent run counts, cue phase, latest
run_id, and pointers to deeper surfaces. It does not replace the debugger;
it tells you whether a deeper drill is worth it.
See the live capture on Run observability.
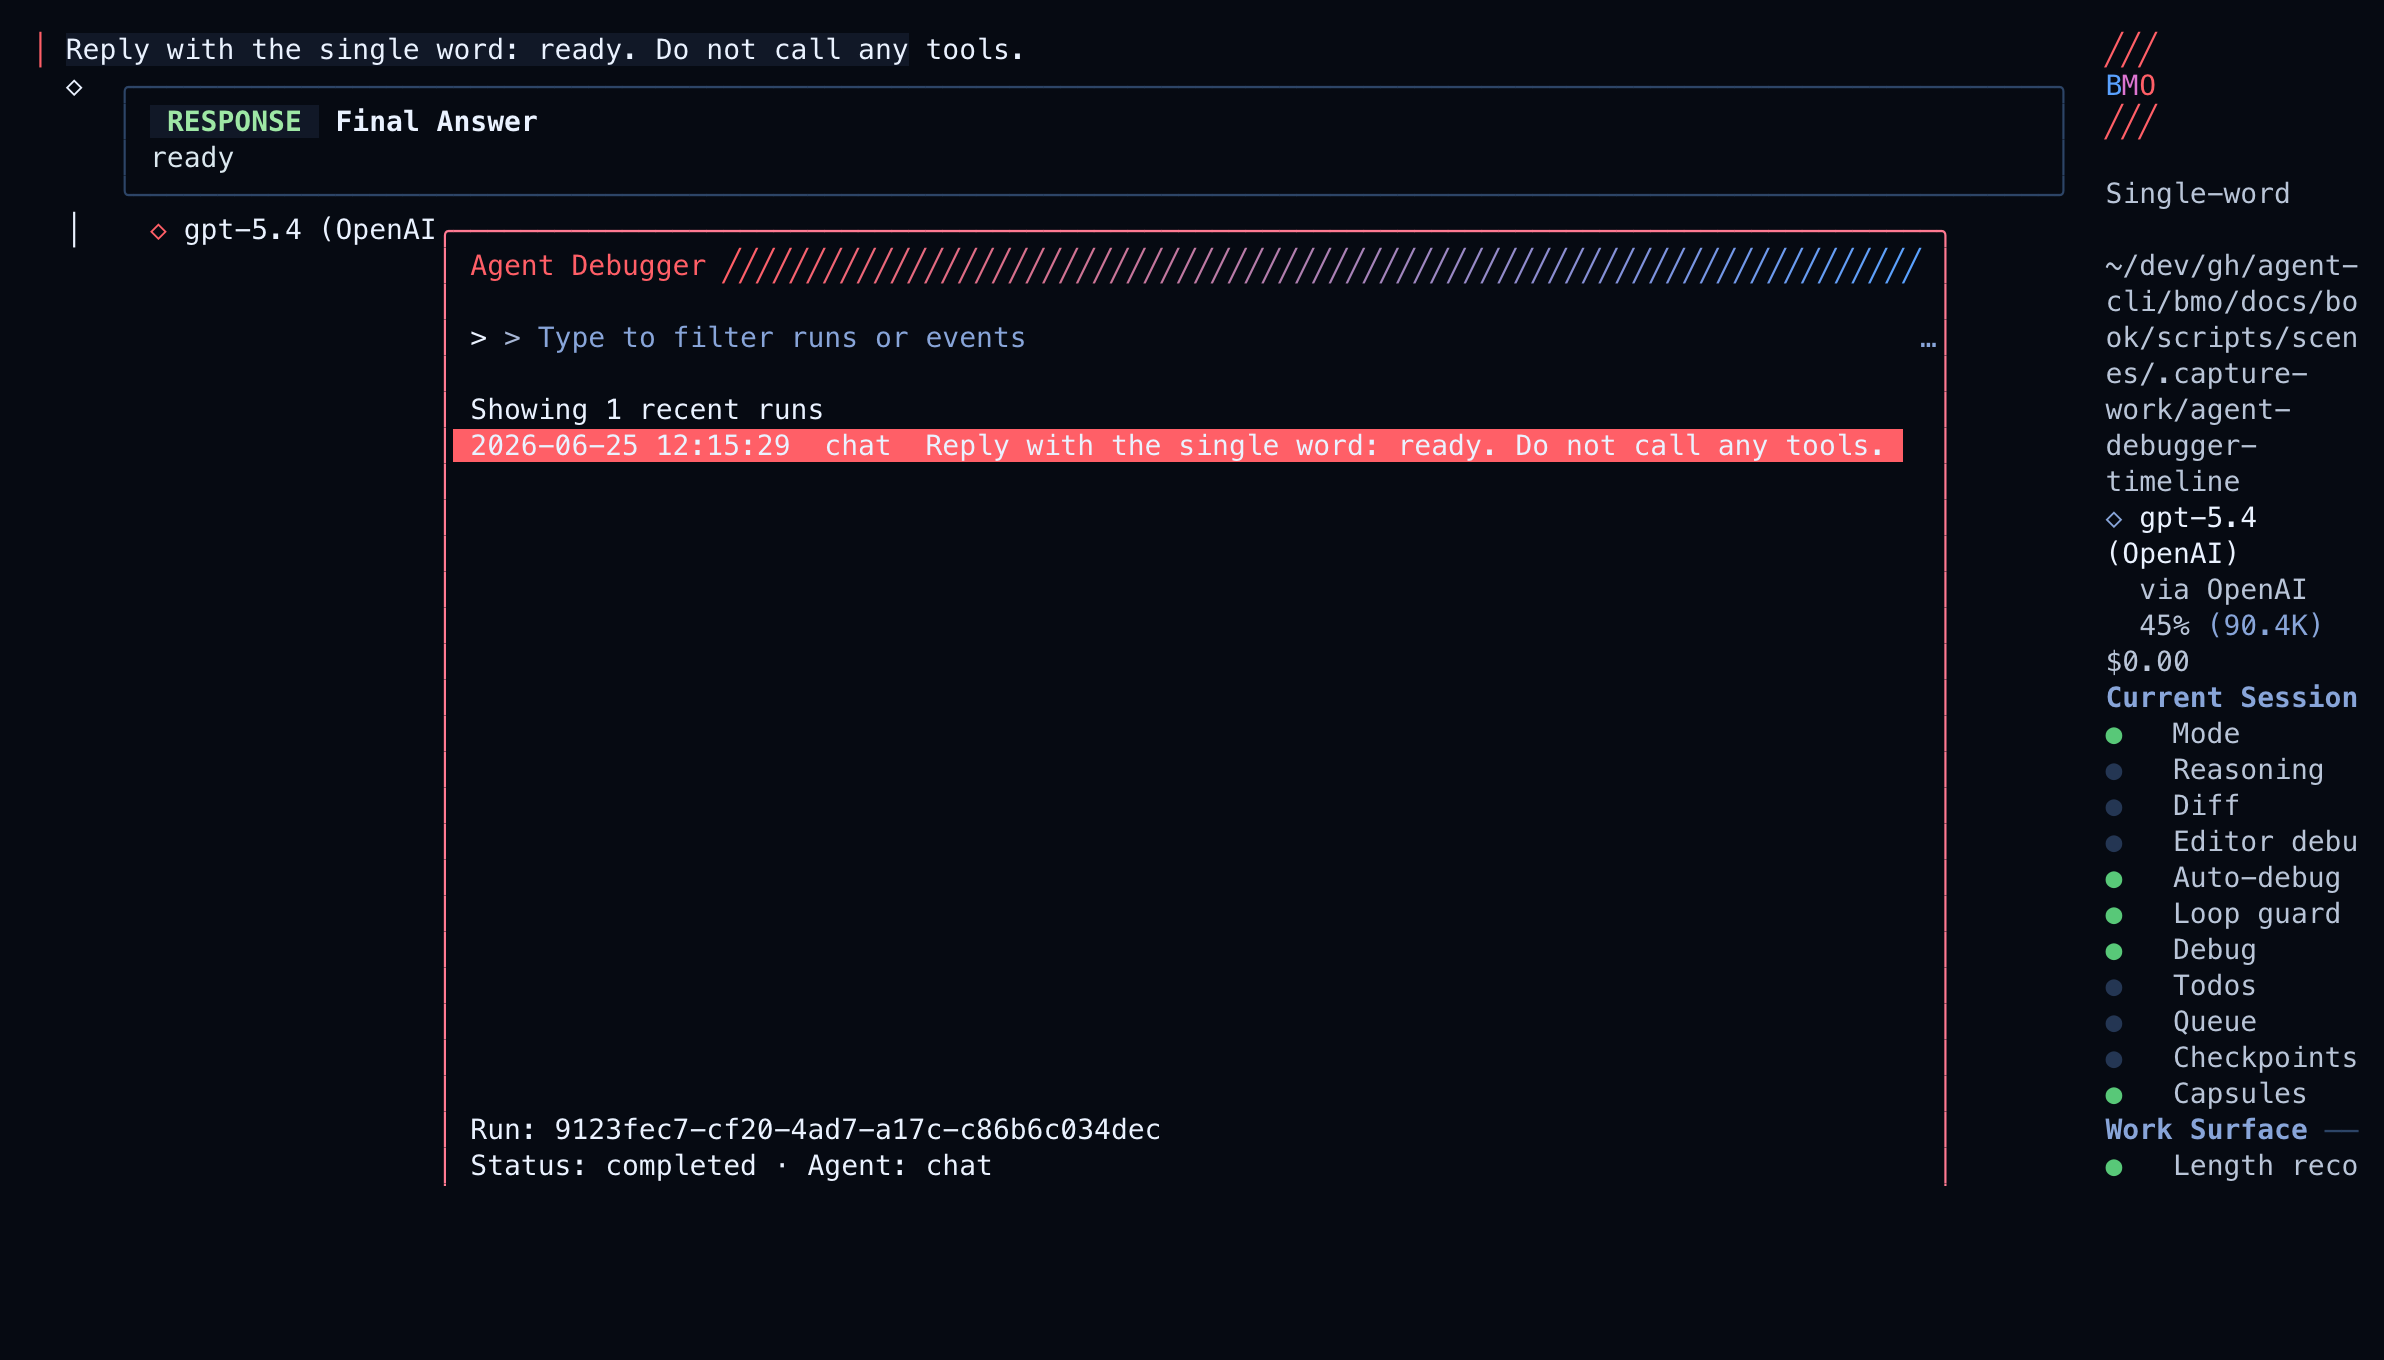
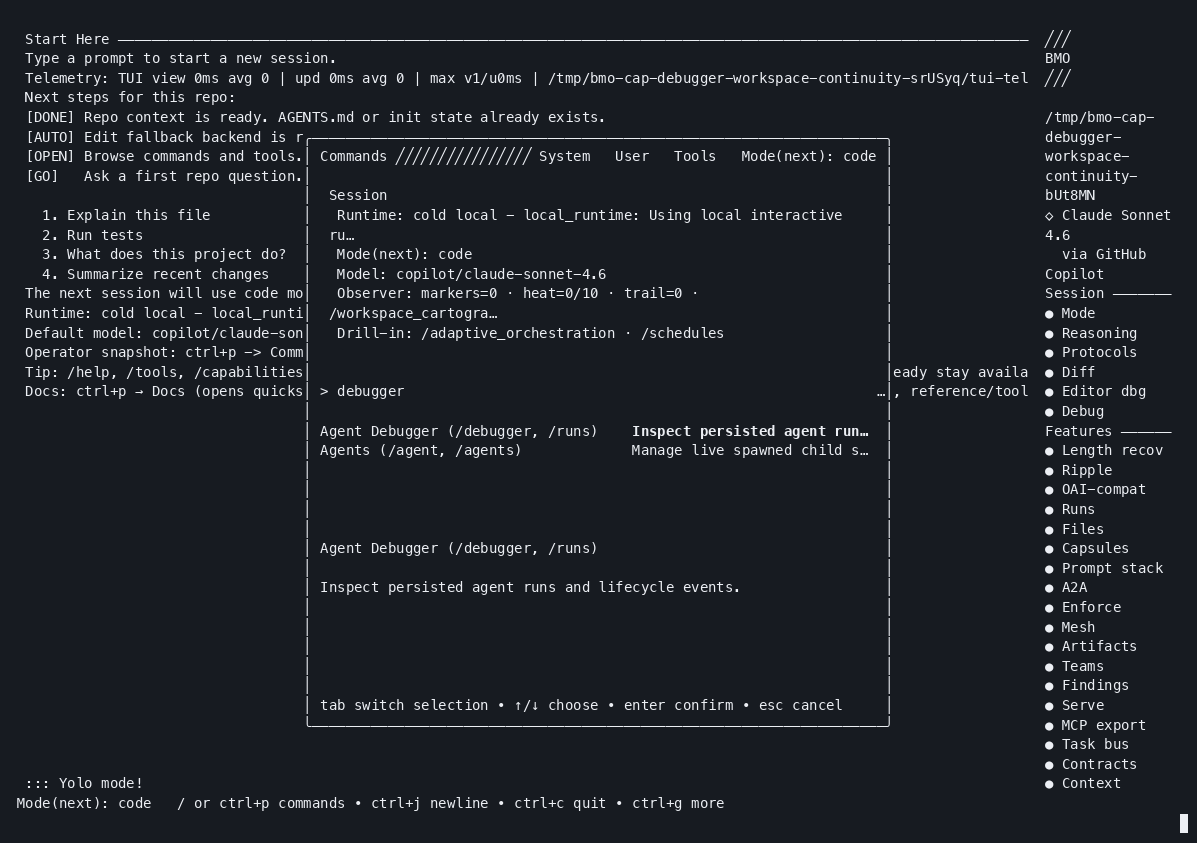
Step 2 — Open the run list
Section titled “Step 2 — Open the run list”In the command picker:
/debuggerAlias: /runs.

Read the frame like this:
| Region | What it teaches |
|---|---|
| Title Agent Debugger | Modal timeline; not a live stream |
| Filter input | Narrows runs or events once a run is open |
| Run rows | Durable agent_runs for this session family |
| Footer keys | enter open timeline · f branch when checkpoint-backed · esc close |
If the list is empty, the ledger has no rows for this family yet — complete a turn first, or check Run ledger posture.
For the compact “who acts next?” projection, use /cue-ledger (documented on
Run observability).
Step 3 — Walk the event timeline
Section titled “Step 3 — Walk the event timeline”Select a run and press enter. The debugger loads ordered
agent_run_events:
What to look for on the timeline:
| Event kind | Why it matters |
|---|---|
| Prompt / policy assembly | Confirms mode, tools, and gates before the model acted |
| Assistant output | What the model said or planned |
| Tool call / result | First place edits or lookups usually go wrong |
| Checkpoint markers | Steps marked forkable can seed a branch session (f) |
| Terminal status | Where the run actually ended — not where chat stopped |
Press d on supported steps for a bounded diff view. Press ctrl+r to
refresh if the run is still active elsewhere.
Step 4 — Branch-and-continue or recover with continuity
Section titled “Step 4 — Branch-and-continue or recover with continuity”When a step is checkpoint-backed, press f. The debugger shows a confirm
screen with the restore target (checkpoint name, message count, restore step vs
selected step) before creating the branch session. The new session keeps lineage
to the original run; restore is best-effort from session checkpoints — not git
working tree or shell side effects.
The recording below shows the fuller story: interruption, timeline evidence, workspace trail context, and a safe resume — the debugger as the sequence layer before recovery.
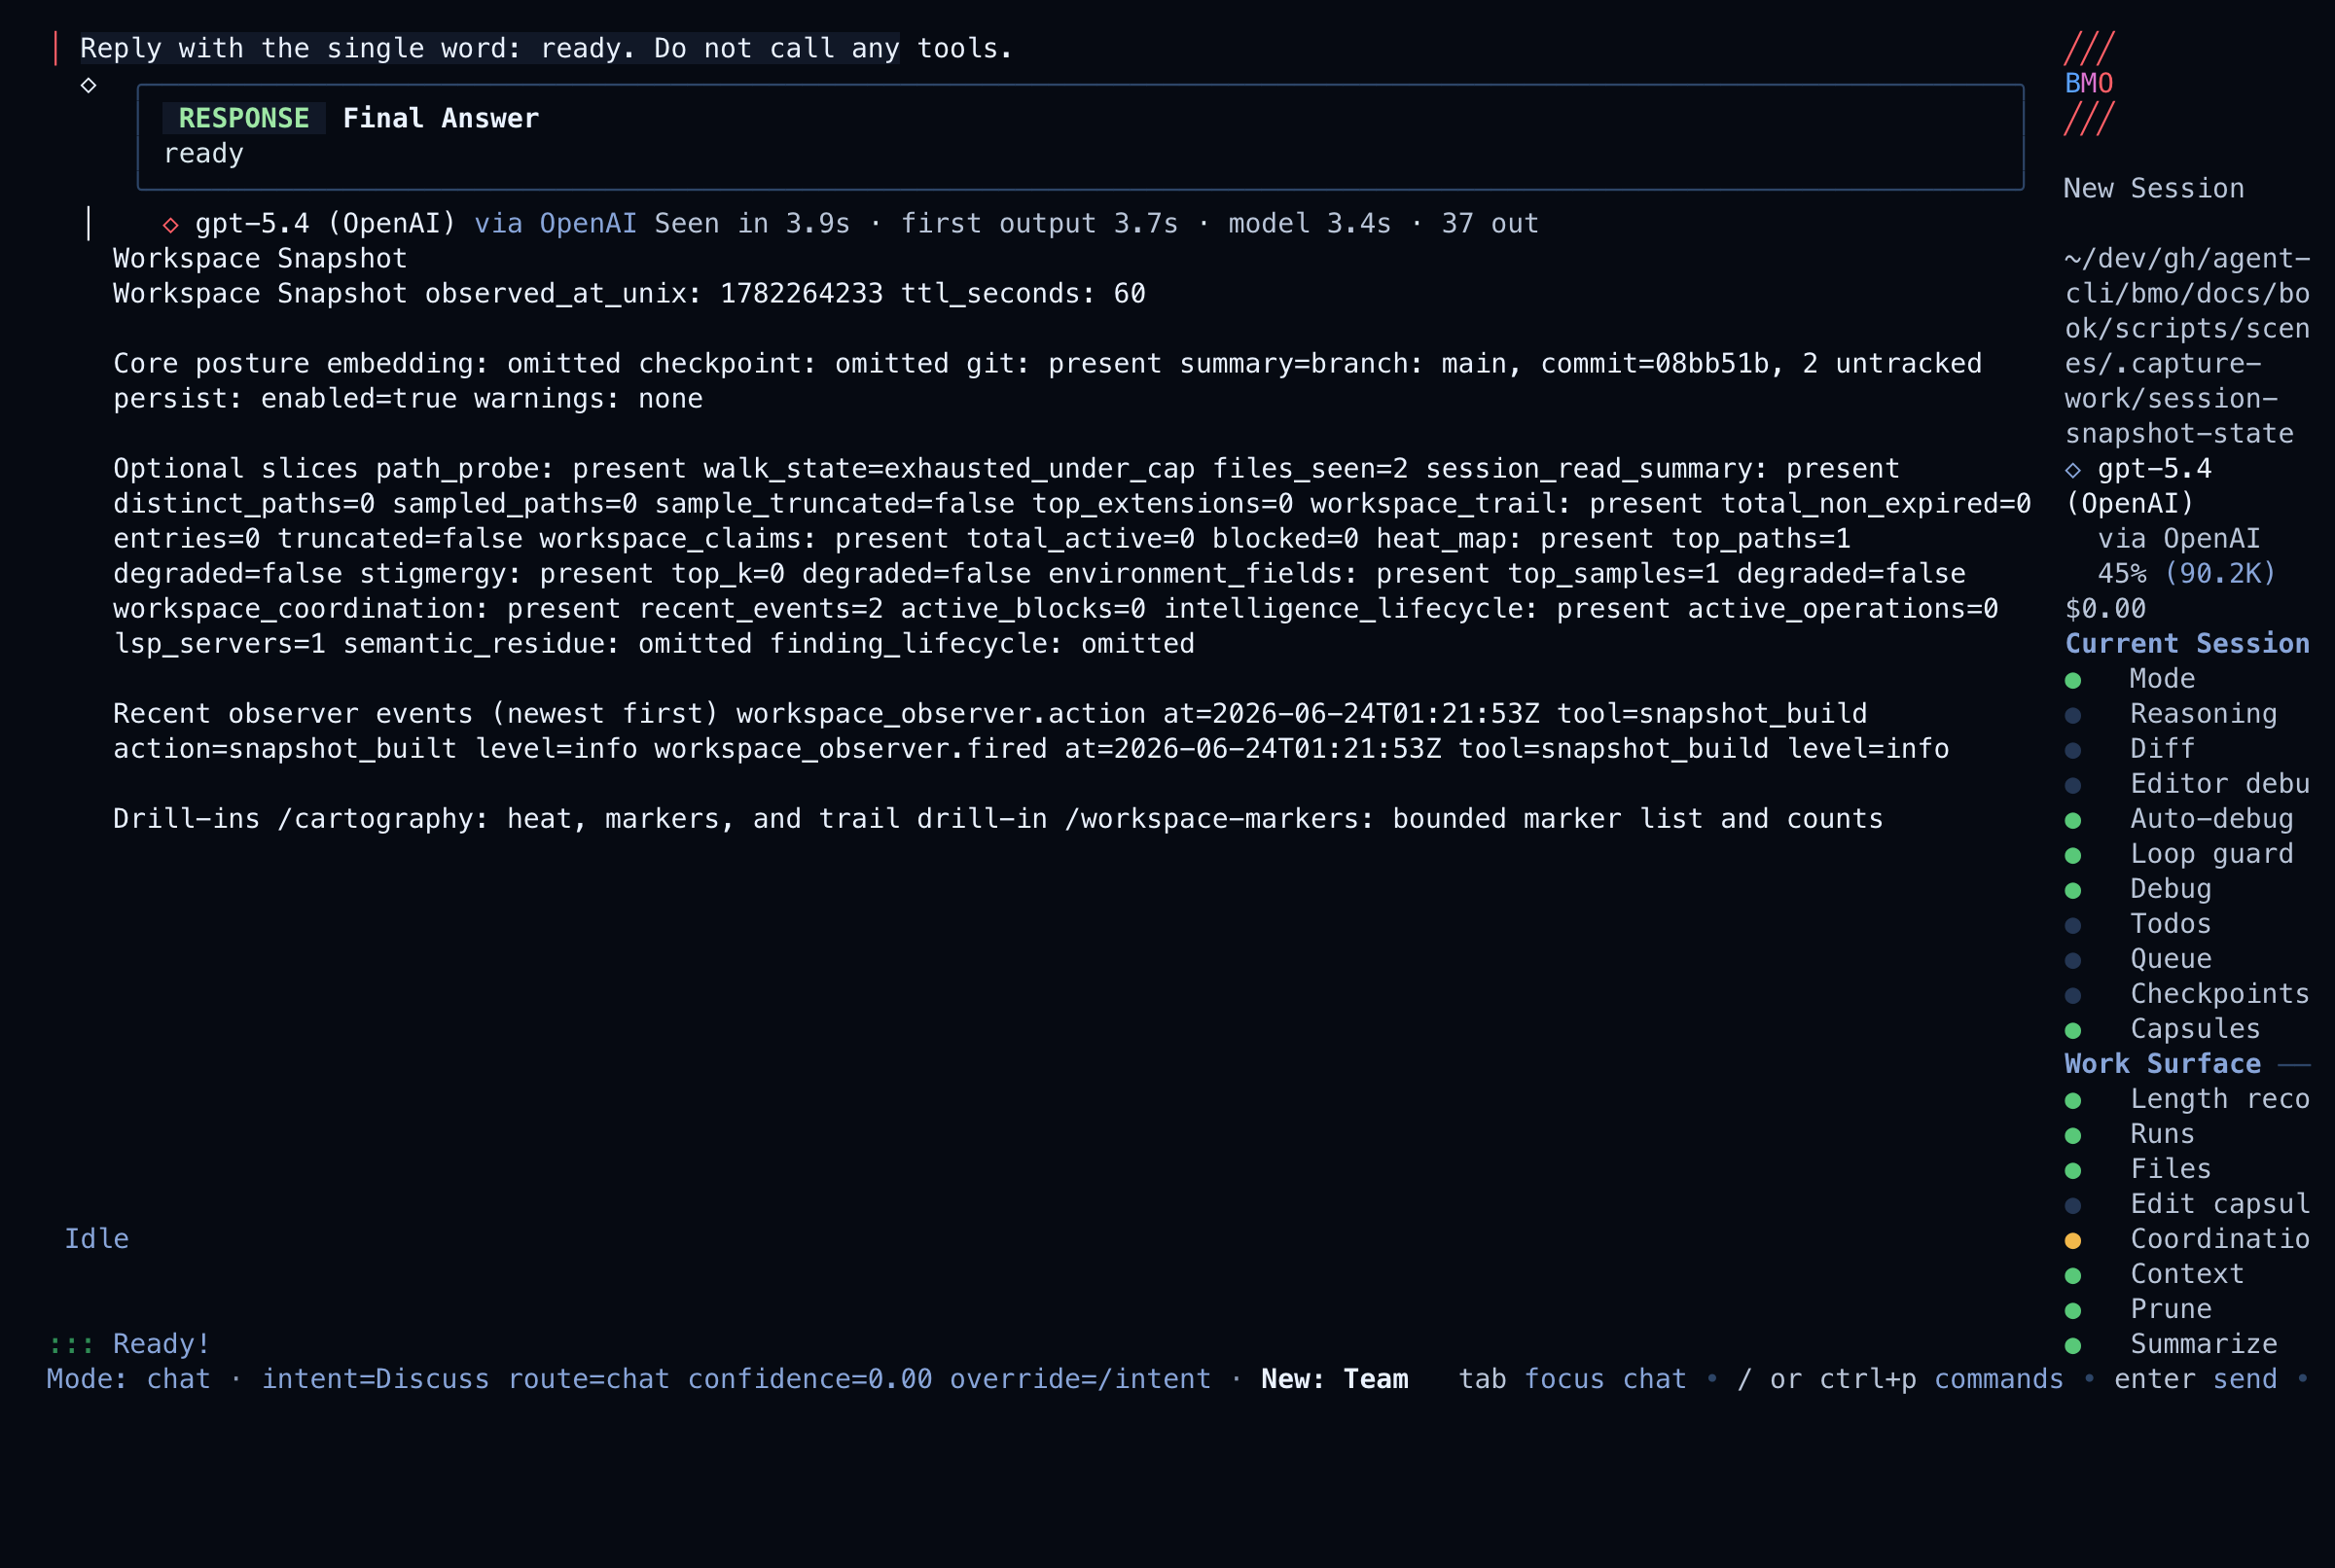
Bounded snapshot vs full timeline
Section titled “Bounded snapshot vs full timeline”/cartography (workspace snapshot) gathers prompt/runtime posture, workspace
diff, checkpoints, and integration health without walking the full run
timeline. Use it when you need “what does the session look like right now?” before
opening a run.
Keyboard controls
Section titled “Keyboard controls”| Key | Action |
|---|---|
up / down | Move through runs or steps |
enter | Open the selected run |
left / backspace | Back to the run list |
ctrl+r | Refresh |
f | Branch-and-continue from a checkpoint-backed step (confirm first) |
d | Diff (when available) |
esc | Close |
What it is not
Section titled “What it is not”The debugger does not provide full terminal recording, token-perfect replay, automatic process rerun, or guaranteed reconstruction of every in-memory transition. The goal is narrower: ordered evidence to debug or branch safely from session checkpoints.
Optional session auto-checkpoint
Section titled “Optional session auto-checkpoint”When agent_debugger.session_auto_checkpoint.enabled is true (default
false), BMO may create session checkpoints after risky tool completions
(edit, write, apply_patch, bash, etc.) on a cadence. This is separate
from workflow.auto_checkpoint (git micro-commits on tool writes).
Programmatic parity
Section titled “Programmatic parity”The same persisted data is available outside the TUI:
| Need | Surface |
|---|---|
| List runs (family scope) | GET /v1/agent-runs?family_session_id=…, list_agent_runs |
| Event timeline | GET /v1/agent-runs/{run_id}/events, get_agent_run_events |
| Bounded session summary | session_observability, Run observability |
| Tool-call-only lens | inspect_run_trace |
| Ledger posture | Run ledger, run_ledger_status |
When the run store is not configured, list/events return empty arrays; single-run GET returns 503.
Topic depth: Agent run ledger, sessions, and lineage —
spawn registry vs durable rows, session_id vs parent_session_id, and which
surfaces use family scope.
Related
Section titled “Related”- Run observability — bounded summary, cue ledger, trace lens
- Run ledger — persistence posture and tracing recipe
- Session observability parity
- Quality Gates — inspect gate decisions on the timeline